for more information visit :www.gurukpo.com
A simple example: Creating a pie chart
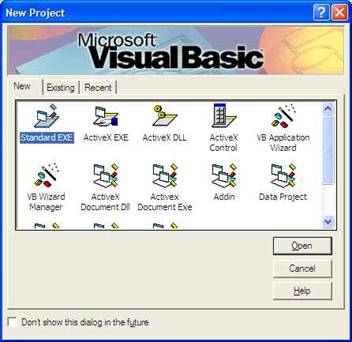
1. Create a Visual Basic project.
A simple example: Creating a pie chart
1. Create a Visual Basic project.
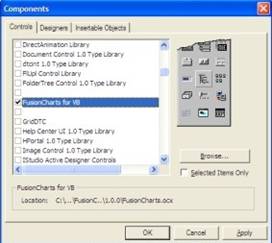
2. Open the component window using CTRL + T or by selecting the ‘Component’ option from the ‘Project’ menu. Next, select FusionCharts for VB, and then click ‘Apply’ and finally the ‘OK’ button.
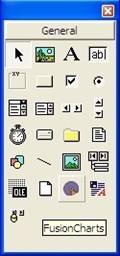
3. Notice, that a FusionCharts icon has now been added to the toolbox.
4. Double click the FusionCharts icon – a chart control will be added to the Form, with a 3D column chart displayed by default. FusionCharts for VB supports multiple data input methods - from XML string (called dataXML method), XML file (called dataURL method), using individual data input, arrays and from databases too.
Since I said this will be a simple example, we will be taking a look at only the dataXML and Individual Data input method. And we will use the other methods in other examples later on in the tutorial.
5. Add the following three buttons to the Form:
Since I said this will be a simple example, we will be taking a look at only the dataXML and Individual Data input method. And we will use the other methods in other examples later on in the tutorial.
5. Add the following three buttons to the Form:
Control | Name | Caption |
| Command1 | cmdIndividualData | &Individual data |
| Command2 | cmdXMLString | XML &String |
| Command3 | cmdExit | E&xit |
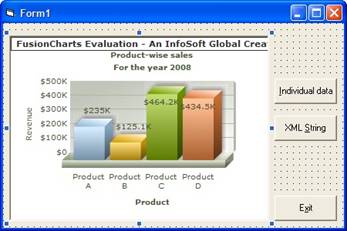
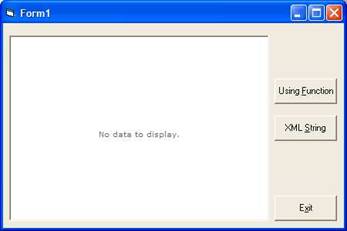
6. Switch to the code view and enter the following code in the code window.
7. Press F5 to run the project - the following screen will be displayed. The screen doesn’t display a chart as data is yet to be loaded.
Private Sub  cmdExit_Click()

    End

End Sub


Private Sub cmdIndividualData_Click()

    FusionCharts1.ChartType = pie3d

    FusionCharts1.Data.setChartParams "caption=Match Score;  xAxisName=Player Name;yAxisName=Score"

    FusionCharts1.Data.addChartData "90",  "label=David"

    FusionCharts1.Data.addChartData "70",  "label=Josh"

    FusionCharts1.Data.addChartData "80",  "label=Brain"

    FusionCharts1.RenderChart

End Sub


Private Sub cmdXMLString_Click()

    Dim XML As String

    XML = "<chart caption='Match Score'  xAxisName='Player Name'  yAxisName='Score'><set value='90' label='David'  /><set  value='70' label='Josh' /><set value='85' label='Brain'   /></chart>"

    FusionCharts1.ChartType = pie3d

    FusionCharts1.setDataXML = XML

End Sub
7. Press F5 to run the project - the following screen will be displayed. The screen doesn’t display a chart as data is yet to be loaded.
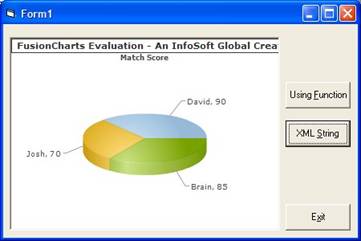
8. Click on ‘Using Function’ or ‘XML String’ button – a 3D pie chart will be displayed.
No comments:
Post a Comment